- Greenhouse Gas Bulletin–annually by the WMO
- Asia Environmental Enforcement Award by the UNEP
- GLOBAL CLIMATE RISK INDEX 2020 + Climate Change Performance Index (CCPI): Germanwatch
- STATEMENT ON CLIMATE OF INDIA– IMD
- WESP2020= UNCTAD + UNDESA + 5 UNREC published
- WORLD ECONOMIC OUTLOOK REPORTS– IMF
- 1st EVER GLOBAL SOCIAL MOBILITY REPORT — WEF
- ANNUAL CRIMES IN INDIA REPORT 2018– NCRB
- DEMOCRACY INDEX– EIU= Economist Intelligence Unit
- Blue Flag Beach– FEE= FOundtaion for Environmental Education
- SEE= Sate Energy Efficiency Index– BEE+ AEEE (Jan_20)
- GTCI Report:GLOBAL TALENT COMPETITIVENESS INDEX by INSEAD, a partner and sponsor of the UNSDG Davos, Switzerland
UNEP
- Emissions Gap Report
- Earthwatch
- Champions of the Earth
- Young Champions of the Earth
GLOBAL TALENT COMPETITIVENESS INDEX 2020
GTCI Report: It is launched by INSEAD, a partner and sponsor of the UNSDG Davos, Switzerland recently.
India= 72 /132… moved up 8 places
1= Switzerland
2= US
3= Singapore
4= Sweden
5= Denmark
6= Netherland
9= Norway
- An annual benchmarking report that measures the ability of countries to compete for talent, their ability to grow, attract and retain talent.
- Theme for 2020 was ‘Global Talent in the Age of Artificial Intelligence’.
- Inequality: The report noted that the gap between high income, talent-rich nations and the rest of the world is widening. More than half of the population in the developing world lack basic digital skills.
India’s GTCI score and GDP per capita are both lower than the other emerging market economies such as BRICS – Brazil (80th), Russia (48th), China (42nd), and South Africa (70th).
India’s key strength relates to growing talent, due to its levels of lifelong learning and access to growth.But need to improve India’s educational system.
Country’s highest-ranked sub-pillar = employability but gap between labour market demand and supply stands in contrast to the country’s poor “mid-level skills”
challenge of attracting and retaining talent and the weak ability to overcome it. India has to strengthen the role of minorities and women to raise the level of internal openness in the country
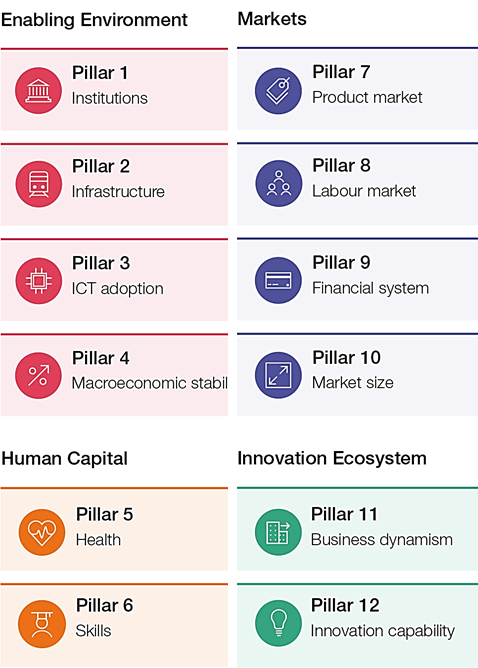
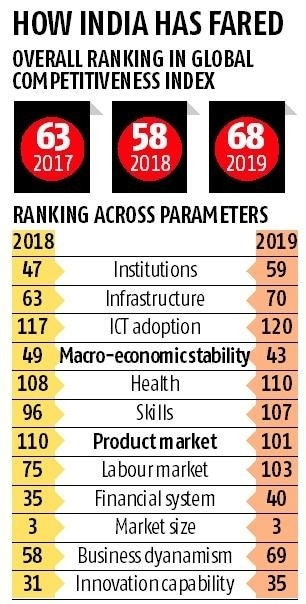
Global Competitiveness Index 4.0: WEF
•India has moved down 10 places to the rank of 68th compared to the 58th rank of 2018
Good in 4 pillars– mm fin inn
Macroeconomic stability
Market size
Financial sector
Innovation
Beyond 100 in 5 pillars
The World Economic Forum (WEF) has released the 2019 edition
4th Industrial Revolution.
- The GCI 4.0 covers 141 economies, which account for 99% of the world’s GDP.
on average, most economies continue to be far from the competitiveness “frontier”—the aggregate ideal across all factors of competitiveness. A country’s performance on the overall GCI is reported as a ‘progress score’ on a 0-to100 scale, where 100 represents the ‘frontier’, an ideal state where an issue ceases
•In South Asia, Sri Lanka is the most improved country in the region at 84th, Bangladesh (105th), Nepal (108th) and Pakistan (110th). •China (28th) is the best performer among the BRICS countries.
The Russian Federation ranks 43rd, South Africa is 60th, India is 68th and Brazil is ranked 71st. •Singapore has become the world’s most competitive economy in 2019, pushing the US to second place
Hong Kong Special Administrative Region (SAR)is ranked 3rd, the Netherlands is 4th and Switzerland is ranked 5th in the index
Travel and Tourism Competitiveness Index
Released by the World Economic Forum.
2018.. (40) —> 2019.. (34)
- Spain, France, Germany, Japan and the United States are the world’s most travel-ready nations.
- Japan remains Asia’s most competitive travel and tourism economy, ranking 4th globally.
- China is the largest travel and tourism economy in Asia-Pacific and 13th most competitive globally.
- Published biennially, Travel & Tourism Competitiveness Report and Index benchmarks the Travel & Tourism (T&T) competitiveness of 140 economies.
- The 140 economies are ranked in four sub-indexes:
- Enabling environment,
- Travel and tourism policy and enabling conditions,
- Infrastructure, and
- Natural and cultural resources.
- The 140 economies are ranked in four sub-indexes:
Global Risk Report: 2020
The World Economic Forum (WEF) has released the Global Risk Report: 2020 before its annual meeting in Davos .
- According to the report, the potential top 5 risks related to the environment over the next decade are:
- Extreme weather events such as floods and hurricanes.
- Failure to prevent and adapt to climate change.
- Major natural disasters such as earthquakes, tsunamis, volcanic eruptions and geomagnetic storms.
- Major biodiversity loss and ecosystem collapse.
- Man-made environmental damage and disasters.
- The report is based on the perception of more than 750 global experts and decision-makers about the potential and impact of global risks.
- Respondents were asked to assess both the likelihood of a global risk occurring over the course of the next 10 years, and the severity of its impact at a global level if it were to occur.
- For the first time in the survey’s 10-year outlook, the top five global risks in terms of likelihood were all environmental, with extreme weather events, human-made environmental damage and disasters and major biodiversity loss and natural disasters from earthquakes to tsunamis all the likeliest risks in 2020.
- In terms of the severity of impact over the next 10 years, the top risk was deemed to be the failure of climate change mitigation and adaptation.
- WEF said that collaboration between world leaders, businesses and policy-makers was needed to stop severe threats to the climate, environment, public health and technology systems.
- This year marks the 50th anniversary of the World Economic Forum in the Swiss Alps, with the theme this year being “Stakeholders for a Cohesive and Sustainable World.”
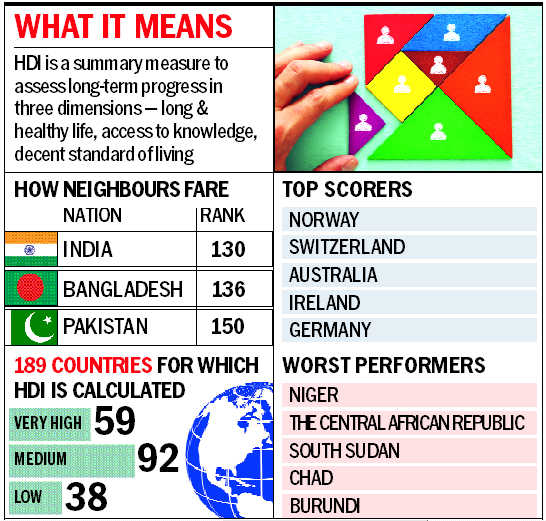
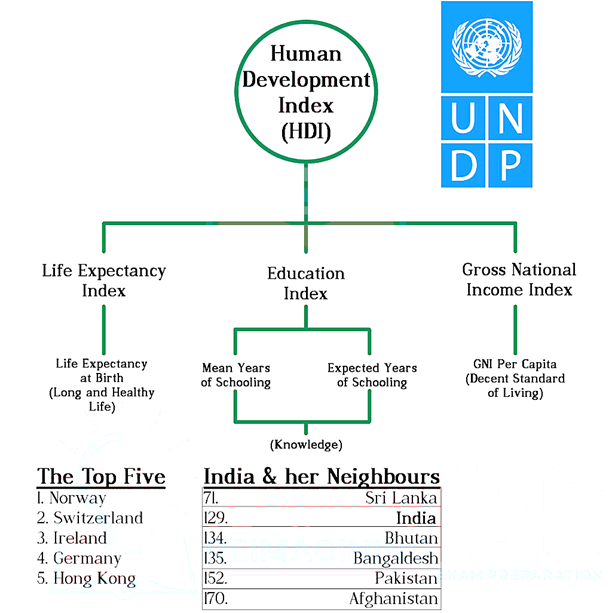
Human Development Index-2019 by UNDP
The focus of the 2019 Report is on ‘Inequality in Human Development’.
Humna Development Report–
2018- India = 129/ 189…
2017= 130
•India’s Performance India’s HDI value increased by 50% (from 0.431 to 0.647), which places it above the average for other South Asian countries (0.642). •In India, between 1990 and 2018, life expectancy at birth increased by 11.6 years, mean years of schooling increased by 3.5 years and expected years of schooling increased by 4.7 years. Per capita incomes rose by over 250%.
Indices that form the part of the 2019 Report are:
- HDI= Human Development Index
- IHDI= Inequality-adjusted Human Development Index ,
- GDI= Gender Development Index ,
- GII= Gender Inequality Index.. India= 122/162… SDG -5
- MPI= Multidimensional Poverty Index.
Above slideshare is is old- 2013 data
Gender Inequality Index
- GII presents a composite measure of gender inequality using three dimensions:
- Reproductive health,
- Empowerment and
- The labour market.
- In GII, India is at 122 out of 162 countries. Neighbours China (39), Sri Lanka (86), Bhutan (99), Myanmar (106) were placed above India.
- The report noted that group-based inequalities persist, especially affecting women and girls and no place in the world has gender equality.
- The report notes that the world is not on track to achieve gender equality by 2030 as per the UN’s Sustainable Development Goals (SDG -5). It forecasts that it may take 202 years to close the gender gap in economic opportunity.
- The report presents a new “social norms index” indicating how prejudices and social beliefs obstruct gender equality, which shows that only 14% of women and 10% of men worldwide have no gender bias.
- The report highlights that new forms of inequalities will manifest in future through climate change and technological transformation which have the potential to deepen existing social and economic fault lines.
GLOBAL HUNGER INDEX-201
Annual publication that is jointly prepared by the Concern Worldwide (an Irish agency) and the Welt Hunger Hilfe (a German organization).
•The report is based on 4 GHI indicators namely–> USWM– undernourishment, child stunting, child wasting, and child mortality.
102/117- 2019
95/116- 2010
India’s child wasting rate is highest for any country – 20.8%
•According to United Nations Children’s Fund (UNICEF), child wasting is a strong predictor of mortality among children (under 5 yrs. of age).
GLOBAL TUBERCULOSIS REPORT 2019: WHO
TB remains the top infectious killer in the world claiming over 4,000 lives a day. •Number of TB Cases: Geographically, most TB cases in 2018 were in the WHO regions of South-East Asia (44%), Africa (24%) and the Western Pacific (18%).
Eight countries that accounted for two thirds of the global total include India (27%), China (9%) and Indonesia (8%).
•Intensified research and development is required to meet the Sustainable Development Goals (SDGs) and End TB Strategy targets set for 2030
WHO End TB Strategy •The strategy aims to end the global TB epidemic, with targets to reduce TB deaths by 95% and to cut new cases by 90% between 2015 and 2035, and to ensure that no family is burdened with catastrophic expenses due to TB. •It sets interim milestones for 2020, 2025, and 2030.
GLOBAL GENDER GAP INDEX 2020: WEF
India = 112th / 153 countries in the annual Global Gender Gap Index for 2020, published by the World Economic Forum (WEF).
•1st gender gap index in 2006.
•Benchmarks countries on their progress towards gender parity in 4 dimensions:
•Economic Participation and Opportunity,
•Educational Attainment,
•Health and Survival and
•Political Empowerment
•Over the Index, the highest possible score is 1 (equality) and the lowest possible score is 0 (inequality).
Key Findings •Globally, the average (population-weighted) distance completed to gender parity is at 68.6%, which is an improvement since the last edition. It will take 99.5 years to achieve full parity between men and women at the current rate of change.
largest gender disparity is in political empowerment. Only 25% of the 35,127 seats in parliaments around the world are occupied by women, and only 21% of the 3,343 ministers are women.
•Iceland has been the frontrunner on the Global Gender Gap Index for 11 years in a row. It has closed almost 88% of its gender gap, followed by Nordic neighbours Norway, Finland and Sweden. •Yemen is ranked the worst (153rd), while Iraq is 152nd and Pakistan 151st.
•India has slipped to the 112th spot from its 108th position in the last edition. India was ranked relatively higher at 98th place in 2006 Report. •India has been ranked below countries like China (106th), Sri Lanka (102nd), Nepal (101st), Brazil (92nd), Indonesia (85th) and Bangladesh (50th).
India has improved to 18th place on political empowerment but it has slipped to 150th on health and survival, to 149th in terms of economic participation and opportunity and to 112th place for educational attainment
India is the only country where the economic gender gap (0.354) is larger than the political gender gap (0.411).
India is among the countries with very low women representation on company boards (13.8%), while it was even worse in China (9.7%).
•The World Economic Forum is the International Organization for Public-Private Cooperation. •It was established in 1971 as a not-for-profit foundation and is headquartered in Geneva, Switzerland
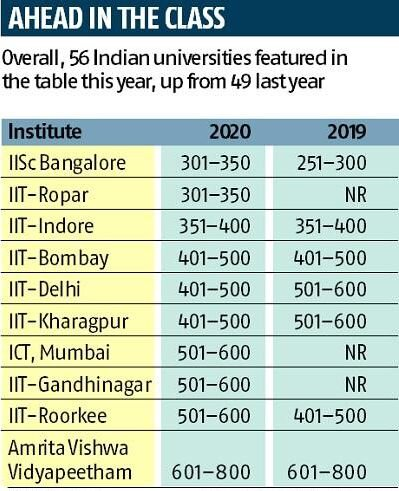
World University Rankings 2020
The TIMES Higher Education (THE) recently released its World University Rankings 2020 edition.
- In its 16th edition, THE’s World University Rankings 2020 included over 1,300 universities from 92 countries.
- 56 Indian institutions (up from 49 last year) made entry into the table this year, making India the fifth most-represented country in the list and the third in Asia (behind Japan and China).
- The University of Oxford retained the top position for the consecutive 4th year
It is the first time since 2012, that an Indian university has not featured in the top 300 of the ranking.
REN21
Renewable Energy Network for the 21st Century (REN21) has released the Renewables 2018 Global Status Report.
•As of 2016, renewable energy accounted for an estimated 18.2% of global total final energy consumption, with modern renewables representing 10.4%.
•India ranked 5th in renewable power (including hydropower) and 4th (not including hydropower) as of end 2017.
INTERNATIONAL INTELLECTUAL PROPERTY (IP) INDEX 2019
Released by U.S. Chamber of Commerce’s Global Innovation Policy Center (GIPC).— evaluates the IP infrastructure in each economy based on 45 unique indicators
India= 36/50 rank <–2019
India= 40/53 rank <– 2020
IMprovement (*2019) —
Accession to the WIPO Internet Treaties,
the agreement to initiate a patent prosecution highway with international patent offices,
a dedicated set of IP incentives for small businesses, and
administrative reforms to address the patent backlog.
• Challenges– patentability requirements, patent enforcement, compulsory licensing, patent opposition, regulatory data protection, transparency in reporting seizures by customs, and Singapore Treaty of Law of TMs and Patent Law Treaty.
WIPO is the global forum for intellectual property services, policy, information and cooperation. It is a self-funding agency of the United Nations, with 189 member states. Headquarters: Geneva, Switzerland.
•Its mission is to lead the development of a balanced and effective international intellectual property (IP) system that enables innovation and creativity for the benefit of all.
•Its mandate, governing bodies and procedures are set out in the WIPO Convention, which established WIPO in 1967.
•Some agreements under the ambit of WIPO:
1 Marrakesh Treaty for visually impaired patients
2 Patent cooperation treaty in 1970
3 Madrid system
WORLD INTELLECTUAL PROPERTY INDICATORS- 2019
United Nations, World Intellectual Property Indicators Report-2019, global Intellectual Property (IP) filing activity continued to grow at a rapid pace.
Asia accounted for 2/3 of these applications, being the global hub for IP applications.
•China has been at the leading position of global growth in worldwide IP filings in 2018 whereas the United States of America marked its first decline since 2009.
Middle income countries–> India— 2015-2017– 16.8% of total published applications mostly patents related to
the pharmaceuticals sector.
Share of withdrawn or abandoned applications was
also highest in India (66.2%).
INDIA INNOVATION INDEX 2019
NITI AAyog–> India Innovation Index 2019
Index goes beyond traditional approaches for measuring innovation such as patents per million of population, publication in scientific journals, percentage of GDP spending on research and adds parameters that are specific to the Indian economy (eg. Demographic dividend), to give it a more holistic coverage.
•Major states, •North-east and hill states, •Union territories/Small states
Karnataka= 1
TN= 2 , MAHARA= 3
Maharashtra performs the best in the dimension of Enablers
Among the North-Eastern states and Union territories, Sikkim and Delhi occupy the top spots respectively
Bihar, Jharkhand, and Punjab were the least attractive states for investment
GLOBAL INNOVATION INDEX-2019
GOI has launched GII = Global Innovation Index in New Delhi.
•This is the 1st time that the GII is being launched in an emerging economy.
DPIIT (MoCI) + WIPO + CII are co hosting the event.
DPIIT= Department for Promotion of Industry and Internal Trade
MoCI= Minsitry of Commerce & Industrialization
WIPO= World Intellectual Property Organization
CII= Confederation of Indian Industry
India’s rank 57–> 52
Global Performance •Switzerland tops the GII index followed by Sweden, United States of America, Netherlands, United Kingdom, Finland, Denmark, Singapore, Germany and Israel
theme of GII- 2019 (12th edition) is “Creating Healthy Lives – The Future of Medical Innovation”
Published annually by Cornell University,+ INSEAD + UN – WIPO
•The GII relies on 2 sub-indices :
•Innovation Input Sub-Index.
•Innovation Output Sub-Index.
Input pillars capture elements of the national economy that enable innovative activities
•Institutions
•Human capital and research
•Infrastructure
•Market sophistication
•Business sophistication.
Output pillars capture actual evidence of innovation outputs:
• Knowledge and technology outputs
• Creative outputs.
Global Climate Risk Index 2020.. Dec
The international environmental think tank ‘Germanwatch’ has recently released the Global Climate Risk Index 2019.
- Worst affected in 2018: Japan, Philippines and Germany
- Worst affected between 1999-2018 (long-term index): Puerto Rico, Myanmar and Haiti
- Deaths and financial loss between 1999-2018: Altogether, about 5 lakh people died as a direct result of more than 12 000 extreme weather events globally. Losses amounted to around US$ 3.54 trillion (in purchasing power parities).
- Poor countries had to face much higher impacts: Of the ten most affected countries and territories in the period 1999-2018, seven were developing countries in the low income or lower-middle income country group, two were classified as upper-middle income countries (Thailand and Dominica) and one was an advanced economy generating high income (Puerto Rico).
- Link between climate change and the frequency & severity of extreme heat: Heatwaves were one major cause of damage in 2018.
India, which suffered water shortages, crop failures and worst flooding, holds the
5th= most vulnerable country to climate change..
It has fallen from its 14th rank of countries hit most by climate change-induced weather phenomena in 2017.
- India has also recorded the highest number of fatalities due to climate change and the 2nd-highest monetary losses from its impact in 2018.
The 2019 Climate Summit in Madrid needs to address the lack of additional climate finance
‘Corruption Perception Index’ (CPI)
India’s ranking slipped from 78 to 80 compared to the year 2018.
- The 2019 CPI draws on 13 surveys and expert assessments to measure public sector corruption in 180 countries and territories, giving each a score from zero (highly corrupt) to 100 (very clean).
- First launched in 1995 by the Transparency International, the Index has been widely credited with putting the issue of corruption on the international policy agenda.
- Transparency International is a non-profit, non-governmental organisation dedicated to fighting corruption. It was founded in 1993 and is based in Berlin, Germany.
Transparency International has recommended a series of measures to combat rising corruption across the world. Following are the recommendations:
- Manage conflicts of interest.
- Control political financing.
- Strengthen electoral integrity.
- Regulate lobbying activities.
- Empower citizens.
- Tackle preferential treatment.
- Reinforce checks and balances.
EASE OF DOING BUSINESS- 2020–> GIVES REPORT ON 2019
World Bank–> Ease of Doing Business Report, 2020. The indicator measures the performance of countries across 10 different dimensions in the 12 month period ending May 1, 2019
1= New Zealand
2= Singapore
3= Hongkong
190= Somalia
63= India (2019) 77 in 2018
India for the third consecutive year was present in the list of 10 economies where the business climate has improved the most.
India’s ranking improved basically on four parameters:
- Starting a Business
- Dealing with Construction Permits
- Trading across Borders
- Resolving Insolvency
•India continues to maintain its first position among South Asian countries. It was 6th (in 2014).
•The World Bank will now include Kolkata and Bengaluru, besides Delhi and Mumbai, for preparing ease of doing business report, in order to provide a holistic picture of the business environment of the country.
10 different parameters namely
•Starting a Business,
•Dealing with Construction permits
•Electricity availability,
•Property registration,
•Credit availability,
•Protecting minority Investors,
•Paying Taxes,
•Trading across borders,
•Contracts enforcement, and
•Resolving Insolvency.
employing workers and contracting with the government but these are not included in the score and rankings.
STATE OF GLOBAL AIR REPORT 2019
The State Of Global Air Report 2019, produced by the Boston-based Health Effects Institute (HEI) has revealed that 1.2 million Indians died due to ailments triggered by air pollution in 2017.
Global risk factors for mortality globally—
Air pollution= 5th
Poor diet> high blood pressure> tobacco exposure> high blood sugar> Air pollution
Globally, air pollution (PM 2.5, household and ozone emissions) is estimated to have contributed to about 4.9 million deaths — 8.7% of all deaths globally and 5.9% of all life years lost to disability, in 2017.
- India and China have the highest health burden from air pollution, followed by Pakistan, Indonesia, Bangladesh and Nigeria.
- In 2017, exposure to PM 2.5 pollution was found to be the third leading risk factor globally for Type 2 diabetes-related deaths and disability after high blood sugar and excessive body weight.
- Globally, such exposure contributed to about 2.76 lakh deaths and 15.2 million life years lost to disability in 2017.
- This burden was highest in India followed by China, Indonesia, Mexico and Brazil.
India-Specific findings
- Air pollution is now the third-highest cause of death among all health risks, ranking just above smoking, in India.
- Over 1.2 million Indians died early due to exposure to unsafe air in 2017.
- Out of the 1.2 annual premature deaths, 673,100 deaths were due to exposure to outdoor PM2.5, and more than 481,700 deaths were due to exposure to household air pollution in India.
- About 60% of India’s population was exposed to household pollution in 2017. However, the report also recognises that the proportion of households cooking with solid fuels in India has dipped from 76% in 2005 to 60% (846 million) in 2017, due to a major government program of shifting households from solid fuels to liquefied petroleum gas.
- Entire Indian population lives in areas with PM2.5 concentrations above the WHO Air Quality Guideline of 10 µg/m3, and only about 15 % of the population lives in areas with PM2.5 concentrations below the WHO’s least-stringent target of 35 µg/m3.
- Exposure to PM2.5 pollution contributed to 55,000 deaths and 2.7 million life years lost from type 2 diabetes in 2017.
- It can be noted that India has initiated major steps to address pollution sources: the Pradhan Mantri Ujjwala Yojana Household LPG program, accelerated Bharat Stage VI vehicle standards, and the new National Clean Air Programme.
- These and future initiatives have the potential, if fully implemented as part of a sustained commitment to air quality, to result in significant health benefits in coming years.
NIRF & ARIIA RANKINGS 2019
IIT Madras has topped the list in ‘overall category’.
•7 IITs are among the first ten position holders whereas JNU, Delhi= 7
•Seven Institutes from Karnataka have made it to the top 100.
•IISc Bengaluru has topped ‘University category’.
•Banaras Hindu University (BHU) has retained its third position in the top 10 universities in the country for the third consecutive year.
NIRF = National Institutional Ranking Framework 2019
ARIIA =Atal Ranking of Institutions on Innovation Achievements -2019
QS WORLD UNIVERSITY RANKING
IIT-Bombay =152= India’s best university for the 2nd year in a row.
•Massachusetts Institute of Technology (MIT) =1 = topped the QS World University Rankings for the 8th consecutive year.
•2 other Indian universities —
IIT Delhi =182 and IISc= 184 — are now under 200.
•Other Indian universities included in the top 500 list are IIT-Madras (271), IIT-Kharagpur (281), IIT- Kanpur (291), IIT-Roorkee (383), University of Delhi (474) and IIT-Guwahati (491).
QS is a leading global career and education network for ambitious professionals looking to further their personal and professional development.
5/23 are privately funded indian institutes are in top 1000
RISING CO2 LEVELS MAY DOUBLE FLOODS
The report “Impacts of Carbon Dioxide Emissions on Global Intense Hydro-meteorological Disasters”–> link between climate change and the rising incidence of hydro-meteorological events–> specifically floods and storms across the world.
The report appears in the January issue of Climate, Disaster and Development Journal .
collected climate data from 155 countries over 46 years (1970 to 2016).
analysis is based on econometric modelling which involves accounting for a country’s vulnerability to hazards, its Gross Domestic Product (GDP), population density and changes in mean rainfall.
The number of intense “hydro-meteorological” disasters could increase by 5.4% annually for an average country facing annually nearly one “extreme disaster”.
- Hydrometeorological disasters include floods, droughts, hurricanes, tornadoes, landslides, etc.
- Extreme disaster is termed as one that causes 100 or more fatalities and/or affects 1,000 or more people).
- risk of extreme floods or storms could double every 13 years at the rate carbon-dioxide concentrations are building up in the atmosphere.
- India faces 5-10 times more risk for extreme disaster being an average country.
